Sending application logs from EKS to Datadog
Datadog has been part of our stack for quite sometime now, where the datadog-agent installed on the EC2 instances (baked into the image) tail log files to which the application services write to.
A recent project required me to send the application logs deployed on kubernetes to Datadog. This required a different approach which I would be sharing today. A few pre-requisites before I begin:
- An up and running kubernetes cluster. I use
eksctlto quickly spin up a k8s cluster on AWS EKS. - A Datadog account
- Helm v3 installed (v3 doesn't require you to setup Tiller (Helm's server component) on your kubernetes cluster)
Pre-requisites
To set the context, I have a 3-node cluster set up:
$ kubectl get nodes
NAME                                        STATUS   ROLES    AGE   VERSION
ip-10-0-0-34.ap-south-1.compute.internal    Ready    <none>   9d    v1.16.13-eks-2ba888
ip-10-0-1-144.ap-south-1.compute.internal   Ready    <none>   9d    v1.16.13-eks-2ba888
ip-10-0-2-79.ap-south-1.compute.internal    Ready    <none>   9d    v1.16.13-eks-2ba888
Add and update the Datadog chart repository,
# Ensure that you are running helm v3
$ helm version --short
v3.3.1+g249e521

# Add and update the Datadog and stable chart repositories
$ helm repo add datadog https://helm.datadoghq.com
"datadog" has been added to your repositories

$ helm repo add stable https://kubernetes-charts.storage.googleapis.com/
"stable" has been added to your repositories

$ helm repo update
Hang tight while we grab the latest from your chart repositories...
...Successfully got an update from the "stable" chart repository
Update Complete. ⎈Happy Helming!⎈

$ helm repo list
NAME   	URL
stable 	https://kubernetes-charts.storage.googleapis.com/
datadog	https://helm.datadoghq.com

# Search for datadog chart. We will be using datadog/datadog
$ helm search repo datadog
NAME           	CHART VERSION	APP VERSION	DESCRIPTION
datadog/datadog	2.4.13       	7          	Datadog Agent
stable/datadog 	2.3.42       	7          	DEPRECATED Datadog Agent
Clone the git repository bensooraj/node-eks-datadog-integration:
$ git clone https://github.com/bensooraj/node-eks-datadog-integration.git

# A quick overview overview of the project structure
$ tree -L 2
.
├── Makefile
├── README.md
├── coverage
├── datadog
│   └── values.yml
├── docker
│   └── Dockerfile
├── kubernetes
│   ├── deployment.yaml
│   └── service.yaml
├── node_modules
│   ├── @dabh
│   ....
│   ...
│   ..
│   ├── winston
│   └── winston-transport
├── package-lock.json
├── package.json
└── server.js

83 directories, 9 files
Check datadog-values.yaml for the latest YAML file.
Deploy the application
We will be deploying an ultra simple Node.js API which logs out JSON formatted log messages whenever it receives a GET request:
// server.js
const express = require('express');
const winston = require('winston');

// Constants
const PORT = 8080;
const HOST = '0.0.0.0';

const app = express();

const logger = winston.createLogger({
    transports: [
        new winston.transports.Console({
            handleExceptions: true,
        })
    ],
    level: 'debug',
    exitOnError: false,
    format: winston.format.combine(
        winston.format.splat(),
        winston.format.timestamp(),
        winston.format.json()
    ),
});

app.get('/', (req, res) => {
    logger.silly("This is a silly message", { url: req.url, environment: "test" });
    logger.debug("This is a debug message", { url: req.url, environment: "test" });
    logger.info("This is an info message", { url: req.url, environment: "test" });

    res.json({
        response_message: 'Hello World'
    });
});

app.listen(PORT, HOST);
logger.info("Running on http://${HOST}:${PORT}", { host: HOST, port: PORT, environment: "test" });
Relevant sections from the deployment YAML file,
apiVersion: apps/v1
kind: Deployment
metadata:
  name: eks-datadog-demo-node-app
  annotations:
    ad.datadoghq.com/eks-datadog-demo-node-app.logs: '[{"source":"nodejs","service":"eks-datadog-demo-node-app"}]'
  labels:
    tags.datadoghq.com/env: "test"
    tags.datadoghq.com/service: "eks-datadog-demo-node-app"
    tags.datadoghq.com/version: "v1.0.1"
spec:
  # # #
  # #
  #
  template:
    metadata:
      annotations:
        ad.datadoghq.com/eks-datadog-demo-node-app.logs: '[{"source":"nodejs","service":"eks-datadog-demo-node-app"}]'
      labels:
        app: eks-datadog-demo-node-app
        tags.datadoghq.com/env: "test"
        tags.datadoghq.com/service: "eks-datadog-demo-node-app"
		tags.datadoghq.com/version: "v1.0.1"
	spec:
      containers:
        - name: eks-datadog-demo-node-app
  # # #
  # #
  #
Pay close attention to the labels and annotations. These are especially useful if you are planning to collect traces and application metrics, which are outside the scope of this article.
It's worth mentioning that you can exclude or include logs from deployments and/or pods by configuring the settings in the annotations. For example, to exclude all logs from the above deployment configure the log_processing_rules in the annotations section as follows:
apiVersion: apps/v1
kind: Deployment
metadata:
  name: eks-datadog-demo-node-app
  annotations:
    ad.datadoghq.com/eks-datadog-demo-node-app.logs: >-
      [{
        "source": "nodejs",
        "service": "eks-datadog-demo-node-app",
        "log_processing_rules": [{
          "type": "exclude_at_match",
          "name": "exclude_this_deployment",
          "pattern":"\.*"
        }]
      }]
  labels:
    tags.datadoghq.com/env: "test"
    tags.datadoghq.com/service: "eks-datadog-demo-node-app"
    tags.datadoghq.com/version: "v1.0.1"
spec:
  # # #
  # #
  #
Deploy the API and exopse it as a service,
# Deployment
$ kubectl apply -f kubernetes/deployment.yaml

# Service
$ kubectl apply -f kubernetes/service.yaml

# Verify that the API is up and running
$ kubectl get deployment,svc,po
NAME                                               READY   UP-TO-DATE   AVAILABLE   AGE
deployment.apps/eks-datadog-demo-node-app          2/2     2            2           30h

NAME                                       TYPE        CLUSTER-IP       EXTERNAL-IP   PORT(S)    AGE
service/eks-datadog-demo-node-app          ClusterIP   172.20.205.150   <none>        8080/TCP   30h

NAME                                                    READY   STATUS    RESTARTS   AGE
pod/eks-datadog-demo-node-app-7bf7cf764f-gpqvf          1/1     Running   0          29h
pod/eks-datadog-demo-node-app-7bf7cf764f-spb7m          1/1     Running   0          29h
Deploy the Datadog agent
Open the file datadog/values.yml and ensure that datadog.logs.enabled and datadog.logs.containerCollectAll are set to true.
datadog:
  ## @param logs - object - required
  ## Enable logs agent and provide custom configs
  #
  logs:
    ## @param enabled - boolean - optional - default: false
    ## Enables this to activate Datadog Agent log collection.
    #
    enabled: true
    ## @param containerCollectAll - boolean - optional - default: false
    ## Enable this to allow log collection for all containers.
    #
    containerCollectAll: true
Deploy the datadog-agent:
$ helm install datadog-agent -f datadog/values.yml  --set datadog.apiKey=<DATADOG_API_KEY> datadog/datadog

# Helm will deploy one datadog-agent pod per node
$ kubectl get deployment,svc,po
NAME                                               READY   UP-TO-DATE   AVAILABLE   AGE
deployment.apps/datadog-agent-kube-state-metrics   1/1     1            1           29h

NAME                                       TYPE        CLUSTER-IP       EXTERNAL-IP   PORT(S)    AGE
service/datadog-agent-kube-state-metrics   ClusterIP   172.20.129.97    <none>        8080/TCP   29h

NAME                                                    READY   STATUS    RESTARTS   AGE
pod/datadog-agent-b4mtv                                 2/2     Running   0          29h
pod/datadog-agent-f6jn7                                 2/2     Running   0          29h
pod/datadog-agent-zvp6p                                 2/2     Running   0          29h
Note that even though the agent is deployed in the default namespace, it can collect logs and metrics from deployments/pods from all namespaces.
O Logs! Where art thou?
Now we have the API service (for generating logs) and the Datadog agent (for streaming the logs to Datadog) all set! I assume this is what happens behind the scenes:
- The API service writes logs to
stdoutandstderr - The
kubeletwrites these logs to/var/log/pods/<namespace>_<pod_name>_<pod_id>/<container_name>/<num>.logon the node machine - The **
datadog-agent**s running on each node tails these log files and streams them to the Datadog servers
Anyways, let's generate some logs:
# Port forward to access the API service from your local machine
$ kubectl port-forward service/eks-datadog-demo-node-app 8080:8080
Forwarding from 127.0.0.1:8080 -> 8080
Forwarding from [::1]:8080 -> 8080

# Generate some logs using curl or ab
$ ab -n 50 -c 2 -l http://localhost:8080/

# Verify that the logs are generated
j$ kubectl logs -l app=eks-datadog-demo-node-app --since=100m
{"url":"/","environment":"test","level":"debug","message":"This is a debug message","timestamp":"2020-09-04T19:35:52.126Z"}
{"url":"/","environment":"test","level":"info","message":"This is an info message","timestamp":"2020-09-04T19:35:53.308Z"}
....
...
{"url":"/","environment":"test","level":"debug","message":"This is a debug message","timestamp":"2020-09-04T19:35:53.310Z"}
{"url":"/","environment":"test","level":"info","message":"This is an info message","timestamp":"2020-09-04T19:35:53.310Z"}
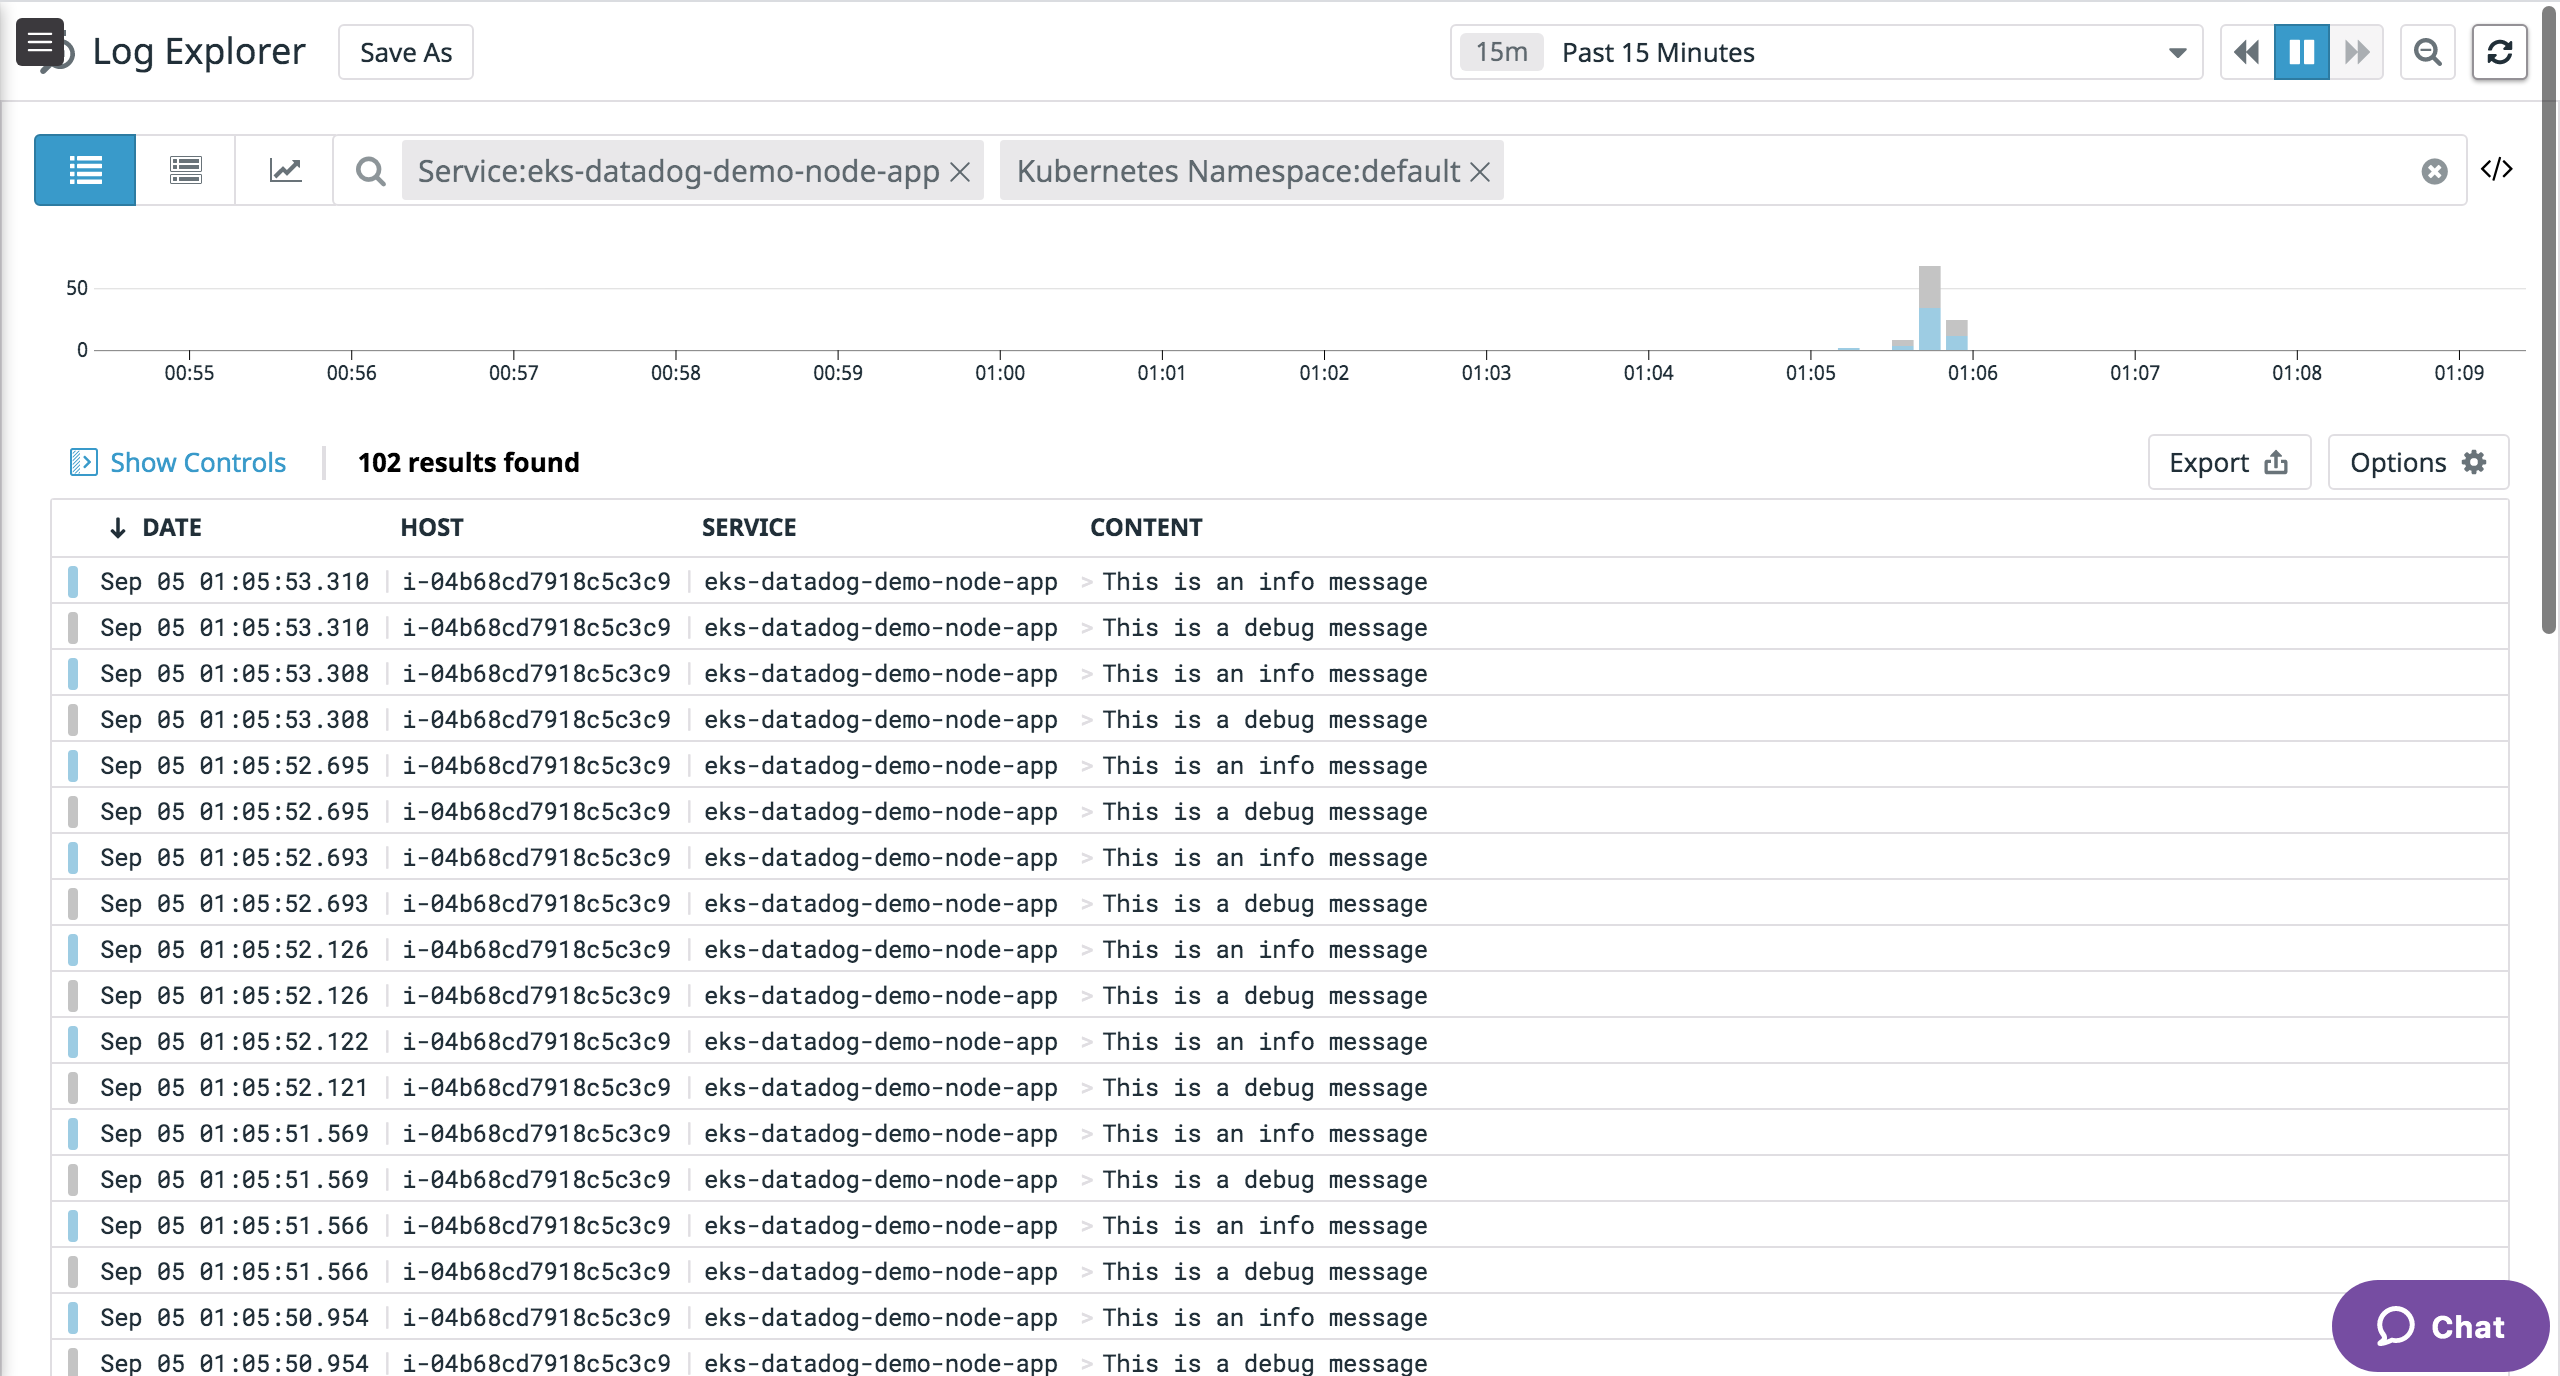
Navigate to Log Explorer in Datadog to see the logs that we generated above
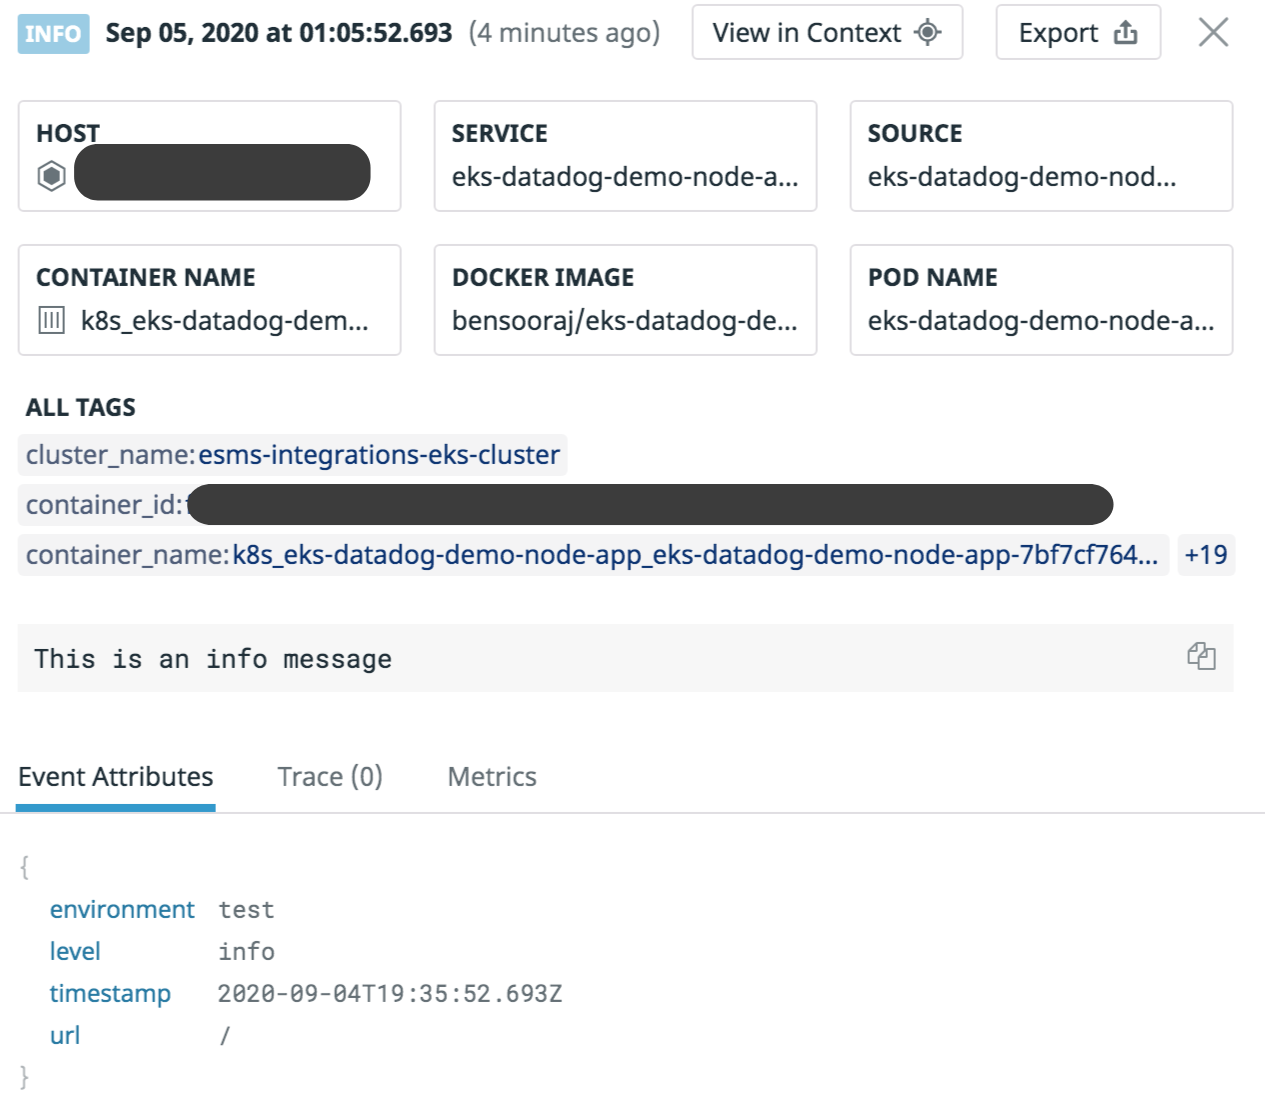
Click on any one of the log records to view more details
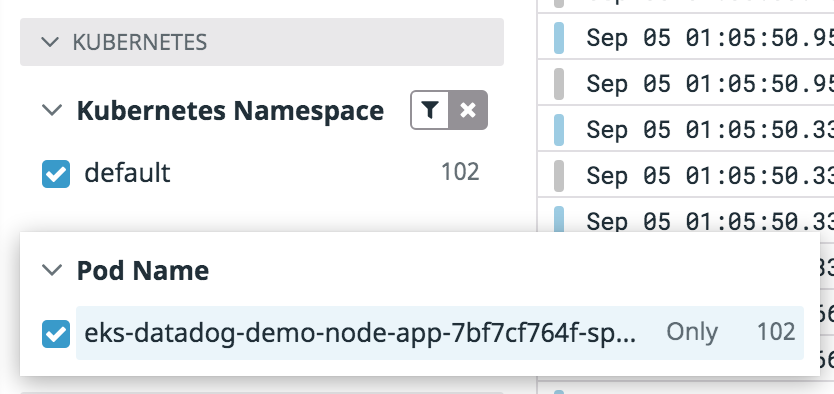
On the left pane, you can filter the logs by namespace, pods etc. as well!
That's it for now!
I hope this helped and if you have any feedback for me, please let me know :smile:.
Further reading:
Note: This article is not an in-depth tutorial on implemending logging for applications running on kubernetes, but a journal of my learnings.